


 Back to Blog
By Emrik Joner
Introduction:
Understanding efficiency is the first step to improving the performance of devices and vehicles containing brushless DC (BLDC) motors. This article explains the key formulas for calculating brushless motor efficiency and demonstrates how they can be used in experimental situations.
This article will help you gain an understanding of how a brushless DC motor operates by providing examples with real data. If you are a drone designer, this knowledge will also help you develop strategies to maximize the flight time and payload of your vehicle.
Table of Contents
- Assumptions
- Brushless motor power and efficiency formulas
- Torque, speed and mechanical power calculations
- Torque, speed and electrical power calculations
- Overall motor efficiency formula
- Heat losses and the best operating point
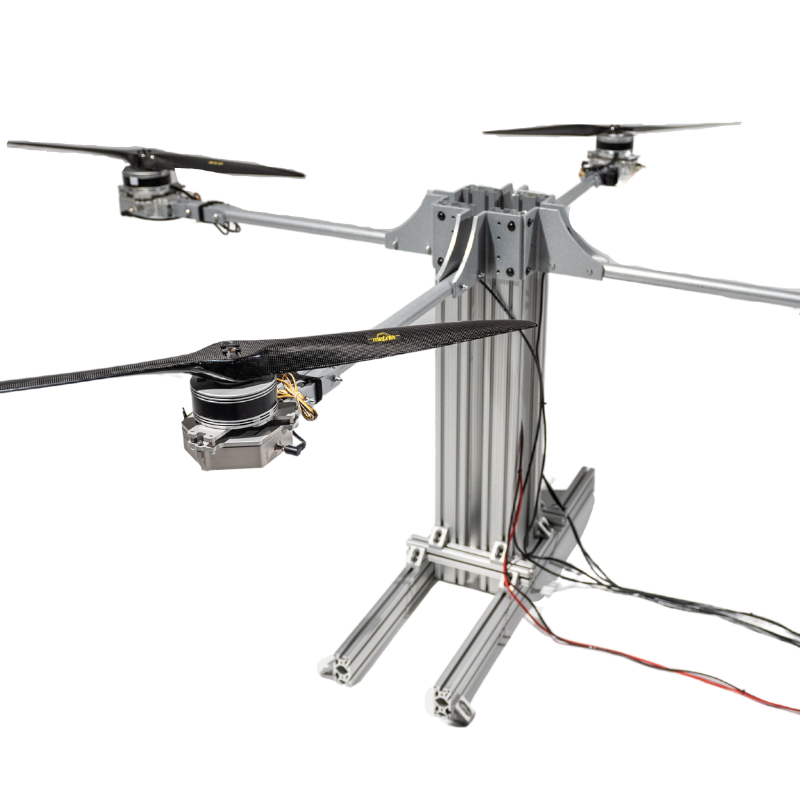
In the experiments described, we used a Series 1585 thrust stand for data acquisition and powertrain control. The theoretical analysis is done in Octave.

Assumptions:
There are two main efficiencies to consider in a brushless system: motor efficiency and propeller efficiency. In order to focus on motor efficiency, we will simplify propeller efficiency and say that the bigger the propeller, the higher its efficiency. Motors, on the other hand, have a high efficiency when spinning at high speed with relatively low torque.
Operating at high torque results in the motor heating up and losing efficiency. That said, the reduced efficiency might be a worthy compromise in order to use a larger, more efficient propeller and to avoid using a gear box, which adds complexity and leads to heat losses.
The theoretical model we use assumes that motor Kv does not change, though this is not exactly true due to the electronic speed controller (ESC). We also simplify heat losses as a simple resistance for use in the calculations, while in a real circuit there is a more complex impedance.
These assumptions and simplifications lead to differences between the theoretical and experimental results, which are interesting to observe through testing.
Further reading: How to Measure Motor Torque and Why You Should
Formula Explanation:
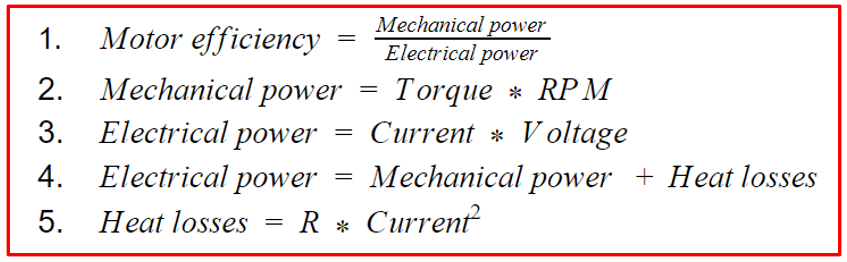
There are several key formulas for understanding brushless motor performance. You can see how motor power and efficiency are closely related and dependent on factors such as torque, RPM, current and voltage.
The Torque-Speed Plot and Mechanical Power:
The torque-speed plot helps us to understand how these two factors are related, as well as what happens when one of them is intentionally set to '0'. Let’s first look at formula 2, which relates the two parameters and describes how to calculate mechanical power:

Mechanical power is the product of torque and RPM, so when there is either no torque or no rotation, no power is produced. Figure 1 provides a visual reference for what this looks like in practice, where we present data from several motor tests.

Figure 1: Mechanical power for a 1500 Kv brushless DC motor
Along the horizontal axis you’ll see several blue circles, these data points were recorded during a no-load motor test. As you can see, when the motor is spinning freely with no load (i.e. no propeller), no torque is generated. An increase in voltage increases the motor’s speed along the horizontal axis, but the mechanical wattage remains at zero. The dynamometer used for the test confirmed the results, also indicating zero torque and zero mechanical power.
The other extreme is to have no rotation speed while slowly increasing the torque, achieved by sending power to the motor but not letting it spin. In theory, this mode of operation would produce a vertical line of data points along the vertical axis with increasing torque but no speed. In practice, motors used by UAVs and drones are not designed to work at very low speeds and would overheat with high torque. We did not want to subject our motors to this much stress, so we only performed this test at low torque, which is why there is only one data point above zero on the vertical axis.
In reality, your motor will operate between these two extremes. The six other power curves in figure 1 demonstrate the results of tests performed with unobstructed motors with propellers. Each dataset represents a different propeller, with the corresponding sizes listed in the legend on the right-hand side (diameter, pitch). As you can see, these propulsion systems occupy the middle of the graph between the two extremes, where regular operation occurs.
The Torque-Speed Plot and Electrical Power:
Electrical power can be determined experimentally or theoretically, and it can be a fun exercise to compare your test results to your theoretical calculations.
Experimental Approach:
When calculating electrical power we can use formula 3, where electrical power is the product of current and voltage. We can also calculate electrical power using formula 4, where it is the sum of mechanical power (RPM*torque) and heat losses.
Figure 3 shows how electrical power relates to torque and RPM. The data points represent the test result from motors equipped with propellers of different sizes and pitch. Similarly to the 3D display of mechanical power in figure 1, the electrical power is proportional to the motor’s torque. However, even when there is no rotation (RPM = 0) and torque is applied, there is still production of electrical power. This is unlike mechanical power, where for all torque values at 0 RPM no power is produced.
Further reading: Drone Design Calculations and Assumptions
Each curve represents a different load (propeller) with speed and torque values plotted. The theoretical values are displayed as a 3D plot represented as a coloured surface, the brighter the shade, the higher the electrical power at that point.

Figure 3: Electrical power for a 1500 Kv brushless DC motor
Theoretical Approach:
To calculate a motor’s electrical power theoretically we use formula 4. To allow us to input values into the formula, we replace ‘mechanical power’ with the right side of formula 2, and ‘heat losses’ with the right side of formula 5, to give formula 6.

Here, R represents the resistance in the circuit generated by the motor (inversely proportional to the torque). The theoretical model assumes that the Kv does not change, which is not exactly true due to the electronic speed controller (ESC). We also simplify heat losses as a simple resistance, while in a real circuit there is a more complex impedance. These distinctions lead to differences between the theoretical and experimental results.

Using the test results we are able to make a 3D plot and fill in most of the variables in formula 7 (torque, RPM, current, and voltage), then we can use this information to find the R value closest to that observed in the experiments. The software Octave makes the 3D representation so the error between the estimated power usage and the real power usage is as small as possible, giving the R value.
Technically, Octave performs a linear regression with the cost function defined as the error of the estimated electrical power used. Formula 7 can also be rearranged to solve for R. Now that we have the R value for our motor, we plug in the values to formula 6 to calculate electrical power.
Overall Efficiency:
The efficiency of a motor is determined by dividing the mechanical power output by the electrical power input (formula 1). A goal for vehicle design is therefore to maximize this ratio and optimize the overall system efficiency by using the biggest propeller possible without overloading the motor.
This is why testing is so important. Using a giant propeller would drastically increase the propeller efficiency, but the motor would struggle so much to make it spin that its efficiency would be ridiculously low. Doing the opposite isn’t great either as making a tiny propeller spin very fast would lower both the motor and the propeller efficiency. The best solution is to balance both efficiencies to get the highest overall performance and system efficiency.
To achieve the highest efficiency the motor has to operate in the yellow zones of Figure 4 and 5 where there is a balance between torque and RPM. Testing various motors can help you figure out which size, Kv, and brand of motor will get you to that sweet spot for your operations.

Figure 4: Motor efficiency for a 1500 Kv brushless DC motor
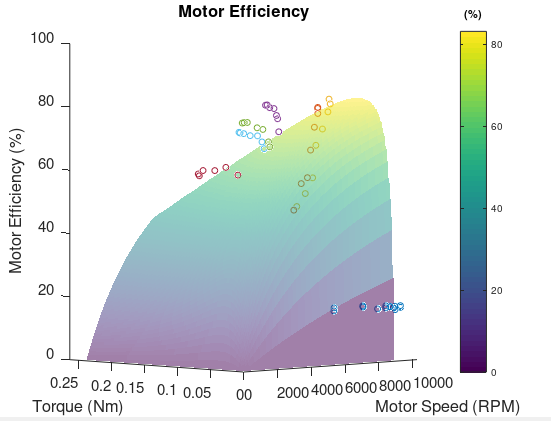
Figure 5: Motor efficiency for a 1500 Kv brushless DC motor in 3D
Interpretation - Best Operating Point
The three graphs in figure 6 demonstrate how motor parameters vary and how to optimize them to achieve higher performance.

Figure 6: Parameters contributing to motor performance
The trend lines on these graphs can help you understand how to optimize your motor’s performance and operating conditions, whether you’re aiming for maximum flight time for your transport drone or maximum power for your racing drone.
In the left-most graph, the horizontal lines represent heat losses, which are dependent only on torque and current, not RPM. The lower torque and current your motor operates at, the lower the heat losses.
The graph in the middle shows the maximum power curve originating from the origin. If the motor does not operate along this line, it is operating at less than full power potential. A max power condition is ideal for winning a race, but not for increasing flight time or endurance.
Finally, the right-most graph shows the maximum efficiency curve. A motor operating on this line will use it’s battery more efficiently than anywhere else on the graph, thus increasing the flight time and endurance.
The location on the graph where you choose to operate depends greatly on the type of operations you are performing. The objectives of your flight should guide your design process and help you make decisions on which components to use.
When modifying the operating range of your motor, you will be looking at changing either your motor size, propeller size or both. In other words, you will be trying to optimize the load of the motor for its size. An easy way to tell if a motor isn’t efficient is to measure it’s temperature. A motor heating up too much is probably overloaded, AKA it is too small for its load. Furthermore, a motor not warming at all is probably too heavy or too big for its load, thus inefficient in that setup. Your needs will help you determine if you should start by modifying your motor or propeller size first.
Conclusion
When evaluating the performance of a motor, using both theoretical and experimental methods will give you the best understanding of your device. The difference between theoretical and experimental results comes from incorporating theoretical assumptions in your calculations, and also from imperfections in your measuring devices. For example, the ESC isn’t perfect and might sometimes activate at the wrong time. Bearing friction is also not taken into account and the measuring instrument’s precision comes with an expected error.
The theoretical model is a good tool to understand intuitively how a change will affect the motor performance. To confirm your assumptions and optimize your system, you need to perform actual measurements in a systematic way. Motor performance can be improved in several ways and the best way to determine them is to compare theory with test results to get a better understanding of your whole system.
We have several tools that can help you test your motor's performance:
- Series 1585 - measures up to 5 kgf of thrust / 2 Nm of torque
- Flight Stand 15 - measures up to 15 kgf of thrust / 8 Nm of torque
- Flight Stand 50 - measures up to 50 kgf of thrust / 30 Nm of torque
- Flight Stand 150 - measures up to 150 kgf of thrust / 150 Nm of torque
The challenges explained throughout this article highlight the need for both approaches to achieve a well-rounded understanding of the components you’re working with and a respect for their limitations. Having several reiterations of a design is very normal as the drone building process operates as a loop: Assume → Build → Test → Repeat.
For a practical extension on how to apply these concepts to your drone design, we recommend reading another one of our articles on How to Increase a Drone's Flight Time and Lift Capacity.
If you have any questions about the contents of this article or the tools we used, don’t hesitate to leave us a comment and we will be sure to respond. If there are any concepts you would like us to cover that we haven’t already, just leave us a note below.


Ali parvin
November 06, 2023
It’s great to be able to post an article