


 Back to Blog
Report by Jean Schmitt
Many UAVs are designed with dual motor or coaxial propulsion systems, where two rotors operate in the same axis of rotation, but in different directions.
There are several variables to consider when designing such systems, such as relative propeller size, speed, and inter-rotor distance. Making the right design decisions allows you to build the highest performing UAV possible - in terms of thrust, torque and efficiency.
We recently completed a study comparing various dual motor and coaxial rotor configurations.
We looked at how each variable would affect performance, including:
- Rotor speed
- Inter-rotor distance
- Propeller size
- Relative rotor speed
We believe that these results are pertinent to all unmanned aircraft designers, as they can inform better vehicle designs resulting in higher efficiency and performance.

Methodology
This report summarizes our findings on physical interactions between rotors during coaxial tests, with a focus on the influence of the front rotor on the rear rotor. We quantified the effects of distance between rotors, rotation speed, and propeller diameter.
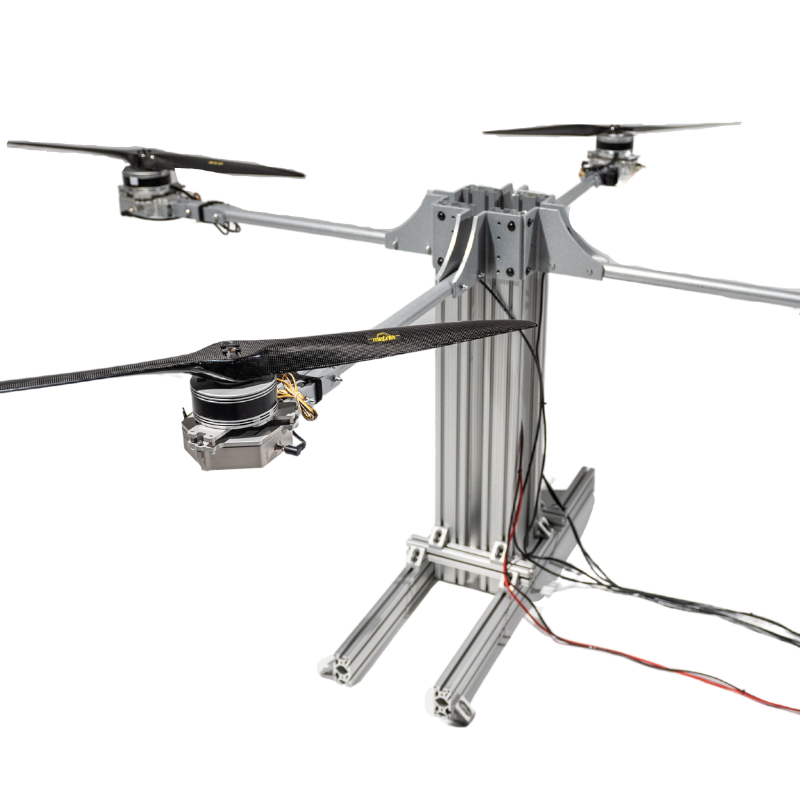
We used two Flight Stand 50 thrust stands for the tests, which measure up to 50 kgf of thrust and 30 Nm of torque, as well as RPM, voltage, current, mechanical power, electrical power, propeller efficiency, motor efficiency, and overall propulsion system efficiency.
The Flight Stand software controls the thrust stand and allows you to test up to 8 powertrains simultaneously.
During the coaxial tests, two Flight Stands were placed back to back on a rail system, with a brushless motor and propeller mounted on each of the stands’ force measurement units (FMUs).
The two propellers were set-up to rotate in opposite directions so that the torques of the motors would compensate one another and balance the structure. In a UAV, this coaxial set-up helps to avoid in-flight vertical axis rotation caused by torque.
The rear propeller was inverted to make sure that the airflow generated was in the same direction as the airflow generated by the front propeller (figure 1).
For the tests where distance between rotors was varied, the distance was measured between the two FMUs.

How Propeller Speed and Rotor Separation Affect Thrust and Torque Generation
We first studied the effects of rotation speed and rotor separation distance on the thrust and torque produced by rotor 2 (R2) in the rear position. We anticipated that the performance of R2 would be affected by rotor 1 (R1) since it is located directly in the airflow generated by R1.
We completed the first set of tests with R1 rotating at two different speeds: 1600 and 2200 RPM. We also repeated the tests at four different separation distances: 10, 30, 50 and 70 mm. The results are shown in figure 2 and 3.

Figure 2: R2 thrust vs. speed at four coaxial separations and two R1 speeds
Figure 2 shows the evolution of R2 thrust as a function of R2 speed, at various R1 speeds and separation distances. As you can see, two groups of curves form, each representing a different R1 speed. The thrust of R2 was lower at all separation distances and R2 speeds when R1 was rotating at the faster 2200 RPM.

Figure 3: R2 torque vs. speed at four coaxial separations and two R1 speeds
Figure 3 shows the evolution of R2 torque as a function of R2 speed, at the same R1 speeds and separation distances as the previous test. Again, two groups of curves form, defined by R1 speed. As with thrust, the torque of R2 was lower when R1 was rotating at 2200 RPM.
For both thrust and torque, it does not appear that the distance between rotors has a significant effect on the thrust generated by R2. In general, we can conclude that an increase in the front rotor (R1) rotation speed reduces the amount of thrust and torque generated by the rear rotor (R2).
Further reading: Brushless Motor Power and Efficiency Analysis
Impact of Rear Propeller Size on Thrust and Torque Generation
In this section we investigate how R2 thrust and torque generation is affected by changing the size (diameter) of its propeller. Two rear propeller sizes were used: 40” (matching the size of the front propeller), and 47”.
Rotation speed was varied while the separation distance between FMUs was held constant at 20mm.


Figure 4: R2 thrust vs. speed with 40” (top) and 47" (bottom) rear propeller
Figure 4 shows the thrust generated by R2 as a function of R2 speed, at four different R1 speeds. The top graph shows results for a 40" rear propeller and the bottom graph a 47" rear propeller. As anticipated, the 47” propeller generated more thrust than the 40” propeller at all R1 and R2 speeds.
A decrease in R2 thrust was observed with both propeller sizes as R1 speed increased from 1600 to 2200 RPM. We observed a similar decline in torque (data not shown). The decline in thrust appeared to be greater for the 47” rear propeller, demonstrated by the greater spread between thrust data points at 1600 RPM and 2200 RPM.
We have two hypotheses for why this might be happening.
Hypothesis 1: the airflow generated by the front propeller applies a force on the rear propeller. This resistive load, which is oriented opposite to the force generated by the thrust of R1 (figure 5), is measured by the FMU. As a consequence, the resistive load is subtracted from the raw thrust value that is recorded.

Figure 5: The thrust and resistive forces experienced by R1 and R2
Hypothesis 2: R1 generates turbulence, and the induced drag counters the thrust and the torque generated by R2. We know this drag exists because of the windmilling effect observed when throttle is applied to R1 but not R2. The faster R1 rotates, the more drag is generated and a more significant loss of thrust will be observed.
When throttle is applied to the front rotor, causing it to rotate, the rear propeller will turn without any throttle. The torque is negative because what is measured is the resistive torque in the motor, which aims at braking the rotation of the propeller. It is induced by the drag generated by the airflow from R1.
Such a reaction can be seen when there is no electrical power input: R2 self-rotates and becomes a kind of wind-turbine (figure 6).

Figure 6: Aerodynamic forces causing windmilling in a rotor blade (source)
The 3D plot in figure 7 shows how R2 torque evolves as R1 and R2 speeds are varied. The blue and yellow sheets were interpolated from the data points shown.
The blue plot shows the evolution of the torque at a 10 mm separation distance between rotors whereas the yellow plot shows torque at a 25 mm distance. This chart demonstrates the presence of negative torque when little or no throttle is applied to R2.

Figure 7: Evolution of the R2 torque depending on the rotors speed - 10mm separation (blue) and 25mm (yellow)
Propeller efficiency
Propeller efficiency is one of the main indicators of rotor performance as it measures the amount of thrust generated relative to the power input.
The propeller efficiency is calculated as the thrust generated divided by the mechanical power of the propeller (propeller rotation speed multiplied by the torque).

We studied how propeller efficiency evolved in relation to rotation speed and separation distance between rotors. In figure 8, R2 propeller efficiency is plotted against R2 speed. Each curve represents a different combination of R1 speed (1600 vs. 2200 RPM), and separation distance (10, 30, 50 or 70 mm).
Measurements were taken at R2 speeds 1200, 1400, 1600, 1800, 2000 and 2200 RPM, and the curves were interpolated based on these points.

Figure 8: R2 propeller efficiency as a function of speed and separation distance
As we can see, two groups of curves form, separated by R1 rotation speed. At all R2 speeds and separation distances, R2 has a higher propeller efficiency for the higher R1 speed of 2200 RPM.
For the curves where R1 rotates at 2200 RPM, there is a consistent decline in R2 propeller efficiency over the full range of R2 speeds. When R1 is at 1600 RPM, there is an increase and peak in R2 efficiency when R2 speed reaches ~1450 RPM, followed by a gradual decline parallel to the other set of curves for the higher R1 speed.
At high speeds, inter-rotor distance plays a negligible effect on R2 propeller efficiency. At lower speeds for both R1 and R2, the smaller separation distance is associated with higher efficiency. This difference is more prominent at low R1 and R2 speeds compared to when R1 speed is high and R2 speed is low. The effect becomes visible when R2 rotates at and below ~1750 RPM.
Conclusion
In conclusion, this study allowed us to observe the effects of several variables on the performance of coaxial rotor systems. We learned that the front rotor has a considerable impact on the rear rotor.
Our study provided several key takeaways:
- Increasing front propeller speed may cause lower thrust and torque generation in the rear propeller.
- Increasing rear propeller size (diameter) may exacerbate the relative decrease in rear propeller thrust generation as front propeller speed is increased.
- In a coaxial setup, a greater overlap between propeller disc areas (%) may lead to a greater loss of thrust in the rear propeller.
- A negative thrust and torque, as well as a self-rotation effect, can be observed in the rear propeller under the influence of the front propeller.
- Rear propeller efficiency may be higher at lower separation distances at low speeds (<1750 RPM).
- At higher speeds (>1750 RPM), the separation distance between propellers has little to no observable impact on rear propeller efficiency.
- Rear propeller efficiency may be higher when the front propeller is rotating at higher speeds.
Further reading: How to Test Brushless Motors
Please let us know in the comments what you would like us to study next!


Drew Darrah
February 20, 2024
The propeller thrust reduction of the aft rotor is actually due to the increase in induced slipstream velocity from the forward propeller. The aft rotor is then seeing a higher velocity airflow and the blade at the same RPM would be at a lower attack angle. Similar to a plane with fixed pitch propeller as it flies faster and faster and runs out of thrust.
Literature reviews for similar studies would help guide your research in the future.
https://ntrs.nasa.gov/api/citations/19970015550/downloads/19970015550.pdf